
August 2026 | Issue 1: Stability Is Not Strength
The Brandenburg Brief
Executive intelligence for leaders who must decide before certainty arrives

THE EXECUTIVE JUDGEMENT
The economy entered the second half of 2026 with genuine activity beneath a slower headline. Consumer spending and business investment remain supportive, while inflation, financing costs, and household financial flexibility constrain durability.
For CEOs, the central risk is not that activity has stopped. It is that continued revenue, freight movement, capital investment, or AI adoption is mistaken for durable financial and organizational strength.
Four Signals to Watch
Federal Reserve: 3.50%-3.75% Federal-funds target range held July 29; business borrowing costs remain elevated.
Logistics: +7.2% U.S. rail intermodal containers and trailers, week ending July 18, versus 2025.
Consumer: 2.7% Personal saving as a share of disposable personal income; household cushion narrowed.
Productivity: +2.8% Nonfarm business output per hour, Q1 2026 versus Q1 2025; latest quarter was only +0.3% annualized.
The Refined Thesis
Visible activity can remain positive while a company becomes less flexible, more leveraged, more concentrated, and less prepared for disruption. Stability gives leaders time. What they build with that time determines whether the organization becomes stronger or merely continues operating.
CONCEPT VISUAL
The Stability Trap
Three ways visible business activity can overstate durable operating strength.
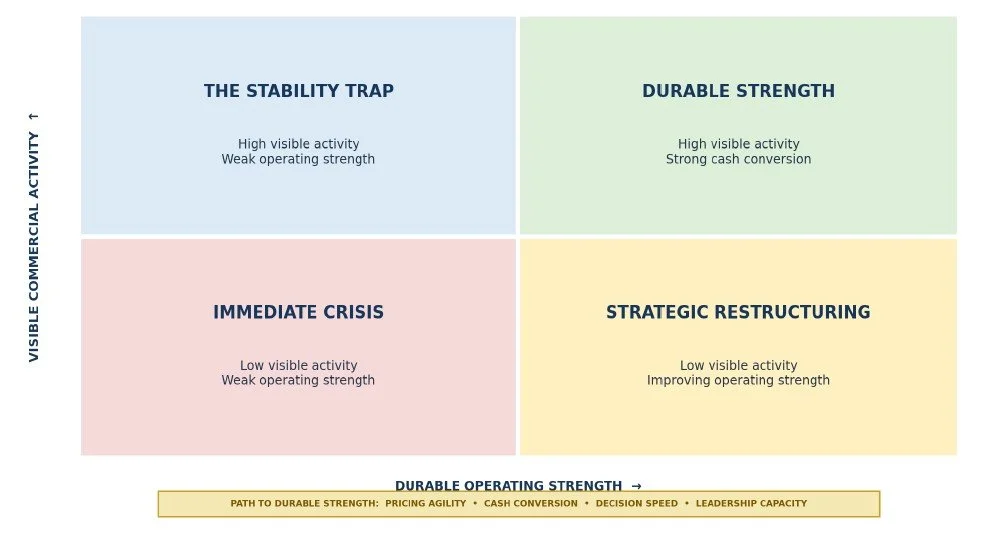
The Stability Trap - three ways visible business activity can overstate durable operating strength.
High commercial activity is not enough. Durable strength requires cash conversion, margin quality, liquidity, resilience, and leadership capacity.
What it shows: High commercial activity is not enough. Durable strength requires cash conversion, margin quality, liquidity, resilience, and leadership capacity.
Why it matters: A company can keep selling, hiring, shipping, or investing while its underlying operating flexibility deteriorates.
CEO implication: Review every positive headline through a second lens: What happened to cash, margin, concentration, and decision capacity?
How the Trap Appears Across Business Models
Products: Revenue growth with rising inventory and freight costs.
Services: Revenue growth with falling utilization and longer billing cycles.
SaaS: ARR growth with rising acquisition cost, delayed implementations, and unmonetized AI expense.
ILLUSTRATIVE CASE ANALYSIS
The Distributor Drag
An illustrative middle-market distributor scenario. This is not a reported company result.

The Distributor Drag - illustrative causal pattern showing how positive revenue can coexist with weakening cash and flexibility.
Strategic assessment
In this illustrative scenario, the distributor appears stable because revenue and EBITDA remain positive. Beneath the surface, flat unit volume, higher freight costs, rising inventory, slower customer payments, and greater revolver use are reducing financial flexibility.
Margin vulnerability: Freight, insurance, labor, and supplier costs rise faster than pricing realization.
Liquidity runway: Inventory and receivables consume cash while the revolver funds normal operations.
Structural concentration: Customers, suppliers, and key-person dependencies limit the ability to adapt.
Broader Application
The same drag appears in services through lower utilization, rising customer acquisition cost, extended payment terms, unbilled work, and excessive dependence on senior rainmakers.
EXECUTIVE SIGNAL DASHBOARD
External Volatility vs. Internal Readiness
Each signal receives one clear rating. External conditions provide context; internal readiness determines outcome.
External Volatility
Economic activity - AMBER: Growing, but uneven.
Consumer demand - AMBER: Spending is resilient; financial cushion is narrow.
Inflation - RED: Core price pressure remains above a stable operating environment.
Interest rates & credit - AMBER: Policy is stable; capital remains selective and expensive.
Jobs & labor - AMBER: Total compensation rose 3.4% year over year through June; benefit costs rose 3.8%.
Freight & supply chain - AMBER: Volume, price, and capacity diverge by mode and lane.
Internal Readiness
Margin resilience - RED: Pricing realization must outpace cost growth.
Liquidity runway - AMBER: Measure cash conversion, covenant headroom, and refinancing timing.
Inventory quality - AMBER: Separate resilience stock from slow-moving stock.
Structural concentration - AMBER: Test customer, supplier, route, system, and key-person exposure.
AI value realization - AMBER: Measure workflow and economic outcomes, not tool adoption.
Leadership capacity - AMBER: Decision concentration creates delay, fatigue, and burnout risk.
How to Use This Dashboard
Do not assume a manageable external environment makes the company ready. A company with weak margin quality, low liquidity, concentrated decision rights, or exhausted leadership can underperform in a stable economy.
MARKET WATCH
Logistics and Supply Chain
One freight headline is not enough. The measures below are volume or demand comparisons, not price measures.
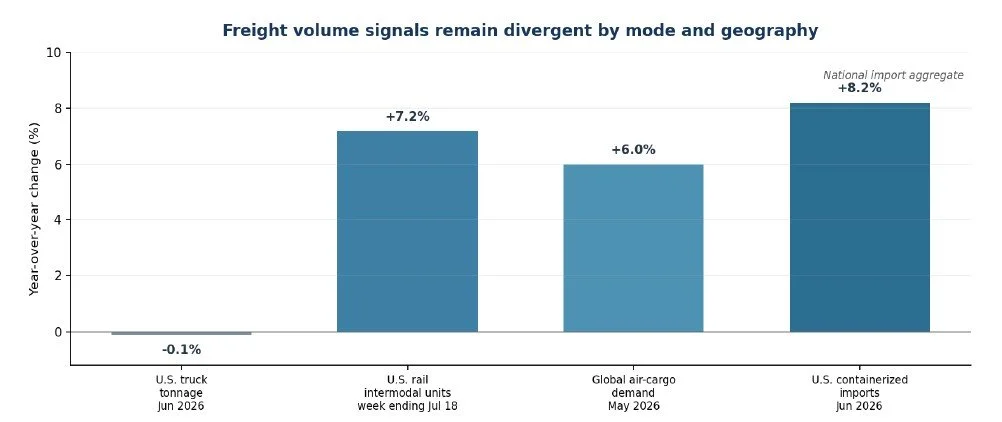
Market Watch - freight volume signals remain divergent by mode and geography.
What it shows: U.S. truck tonnage was nearly flat year over year, while rail intermodal units, global air-cargo demand, and the national aggregate of U.S. containerized imports increased.
Why it matters: June import activity was up 8.2% from a year earlier, but first-half volume was nearly flat. Front-loading and lane shifts can create a strong month without proving sustained demand.
CEO implication: Model exposure by mode, lane, commodity, timing, capacity, and contract structure. Do not apply one freight assumption across the business.
Direct callout: Soft shipment demand does not necessarily mean lower transportation expense. Capacity discipline, disruption, rerouting, and yield management can keep transportation budgets elevated.
MARKET WATCH
Capital, AI, and Productivity
Productive investment is accelerating, but the productivity payoff remains uneven.
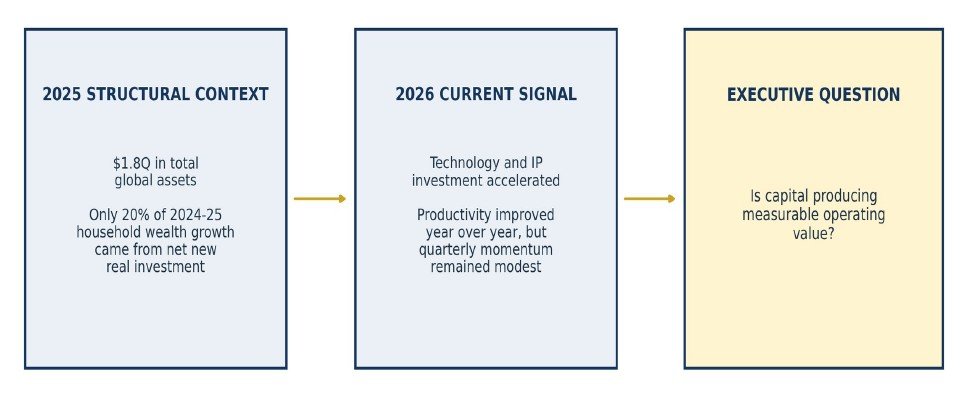
Market Watch - capital formation creates technical capacity, but adoption and value realization remain management responsibilities.
Current Conclusion
The global balance sheet entered 2026 heavily influenced by elevated asset values. In the United States, real investment in technology, intellectual property, equipment, and AI infrastructure is accelerating. The unresolved question is whether that capital will produce broad, sustained productivity gains sufficient to justify its cost.
What it shows: The 2025 McKinsey data describe the stock and composition of global wealth. The 2026 BLS and BEA data show current investment and productivity direction.
Why it matters: Capital formation creates technical capacity, but adoption and value realization remain management responsibilities.
CEO implication: Evaluate AI and capital by measurable throughput, cycle time, margin, customer value, labor capacity, and cash generation.
The AI Value Trap
Beware vendor-driven AI inflation: premium subscriptions and “AI-enabled” upgrades can raise fixed overhead without changing workflows, improving customer outcomes, or creating competitive leverage.
LEADERSHIP INSIGHT
Leadership Capacity Is Operating Capacity
The human constraint is not separate from strategy. It determines whether the company can act before certainty arrives.
The Operating Principle
Concentrated decision-making, unclear authority, and repeated escalation to the CEO slow execution and exhaust the people the company can least afford to lose. Stability can hide the deterioration until the next disruption exposes it.
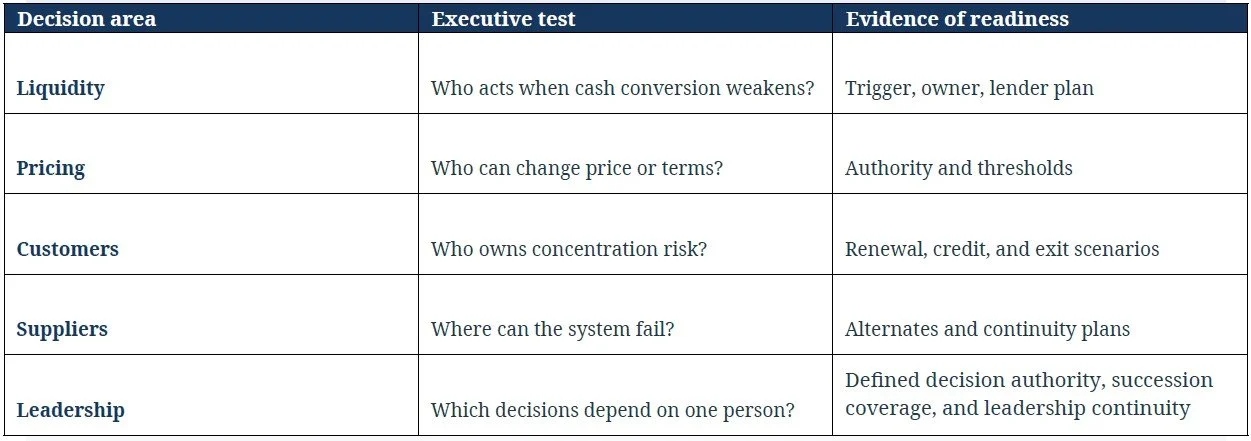
Leadership Insight - leadership capacity is operating capacity.
Leadership Capacity Indicators
Track decision backlog, executive overtime, repeated escalations, regrettable turnover, and the percentage of major decisions that still require the CEO. These are operating indicators, not merely cultural observations.
CEO ACTION AGENDA
Convert Activity Into Strength
Practical decision rules, not universal benchmarks.
1. Protect margin - Shorten quote validity, add escalation clauses, set authority thresholds, and measure pricing realization against cost movement.
2. Protect liquidity - Set a board-approved minimum liquidity floor based on payroll, fixed obligations, debt service, concentration, seasonality, and time to secure replacement capital.
3. Improve cash conversion - Track DSO, DPO, inventory days, billing cycle, unbilled work, and cash conversion by customer, vendor, product, and service line. Reduce collection delays, improve inventory velocity, and negotiate payment terms without damaging critical supplier relationships.
4. Reassess capital - Recalculate hurdle rates using the company’s actual cost of debt, equity risk, implementation risk, and time to value.
5. Measure AI value across two horizons - Define the current operating problem and the future capability the company is building. Every initiative should have a baseline, owner, measurement period, strategic time horizon, and expand-modify-stop decision.
6. Distribute authority - Clarify decision rights before volatility forces every decision back to the CEO.
7. Reduce concentration - Identify dependencies that cannot fail gracefully and build alternatives before they become urgent.
Illustrative, Not Universal
A volatile-lane seller might shorten quote validity from 30 days to 7-10 days. For AI, leaders should ask: What should improve next quarter? What capability must exist in three to five years? How does it support the future business model? What must be true for continued investment to be justified?
The CEO Diagnostic
Would Your Business Become Stronger - or Merely Continue Operating?
Use these questions to distinguish activity from progress and continued operation from durable strength.
Is revenue growth driven by real volume, pricing, mix, acquisition, or timing?
Are gross margin and operating cash flow improving at the same rate as revenue?
Is inventory strategic, productive, and moving - or quietly consuming liquidity?
What happens to covenant headroom if EBITDA declines or cash conversion slows?
Where would the loss of one customer, supplier, route, system, or key leader create a material operational or financial impact?
Can every AI or capital investment be tied to the company’s future vision, a defined operating outcome, an accountable owner, and a clear decision about whether to expand, modify, or stop?
Is the leadership team gaining capacity - or absorbing more decisions, fatigue, and key-person risk?
One Big Question
If current economic conditions remained broadly unchanged for the next 18 months, would your business become stronger, or merely continue operating?
Recommended Resource
The Global Balance Sheet 2026: Imbalance and Divergence - McKinsey Global Institute. Use as structural context on asset values, productive investment, and resilience. Pair it with current 2026 investment and productivity evidence rather than treating 2025 data as a current-period indicator.
The Brandenburg Reflection
Activity is not the same as strength. Stability gives leaders time. What they build with that time determines whether the organization becomes more durable or merely continues operating.
Sources
Federal Reserve; Bureau of Economic Analysis; Bureau of Labor Statistics; Association of American Railroads; International Air Transport Association; American Trucking Associations; Descartes Datamyne; McKinsey Global Institute. Source dates and comparison periods are noted in the relevant sections of the original August 2026 issue.
