
September 2026 | Issue 2: Relief Is Arriving Unevenly
Relief Is Arriving Unevenly
A better headline economy does not automatically create better economics for your business.
EXECUTIVE SUMMARY
The economy is not broadly weakening. It is not broadly strengthening either. It is separating. Growth continues, but consumers, labor, inventories, capital, geography, freight, and operating costs are moving at different speeds. For CEOs, the practical question is no longer simply what the economy is doing. It is which economy their own business is actually operating in.
Four signals worth seeing before you read the rest

Which economy is my business actually operating in?
Data through August 31, 2026. Primary sources include BEA, U.S. Census Bureau, Federal Reserve, Dallas Fed, AAR, IATA, and The Conference Board.
The Economic Headlines Are Improving
There are legitimate reasons for optimism. Business activity continues. Productivity has improved. Manufacturing has shown pockets of strength. Capital investment remains active in technology, infrastructure, energy, data centers, and advanced manufacturing. Consumers are still spending, and broad layoffs have not taken hold.
But the better headline story is not arriving evenly inside companies. A business can grow revenue while margins compress. It can carry more inventory while cash conversion slows. It can retain employees while struggling to hire critical skills. It can invest more while confidence remains cautious. It can see stronger orders while raw-material costs stay elevated.
More activity does not automatically mean better economics.
WHAT THIS MEANS FOR CEOS
Do not mistake resilience for broad relief. The headline economy can improve while the cost of capital, pricing pressure, talent constraints, or working-capital strain remain very real inside your business.
That is why this issue focuses less on whether the economy is up or down and more on where the signals are separating. In a segmented environment, leadership advantage comes from seeing the contradiction earlier than the market does.
Consumers: Income Improved. Real Spending Barely Moved.
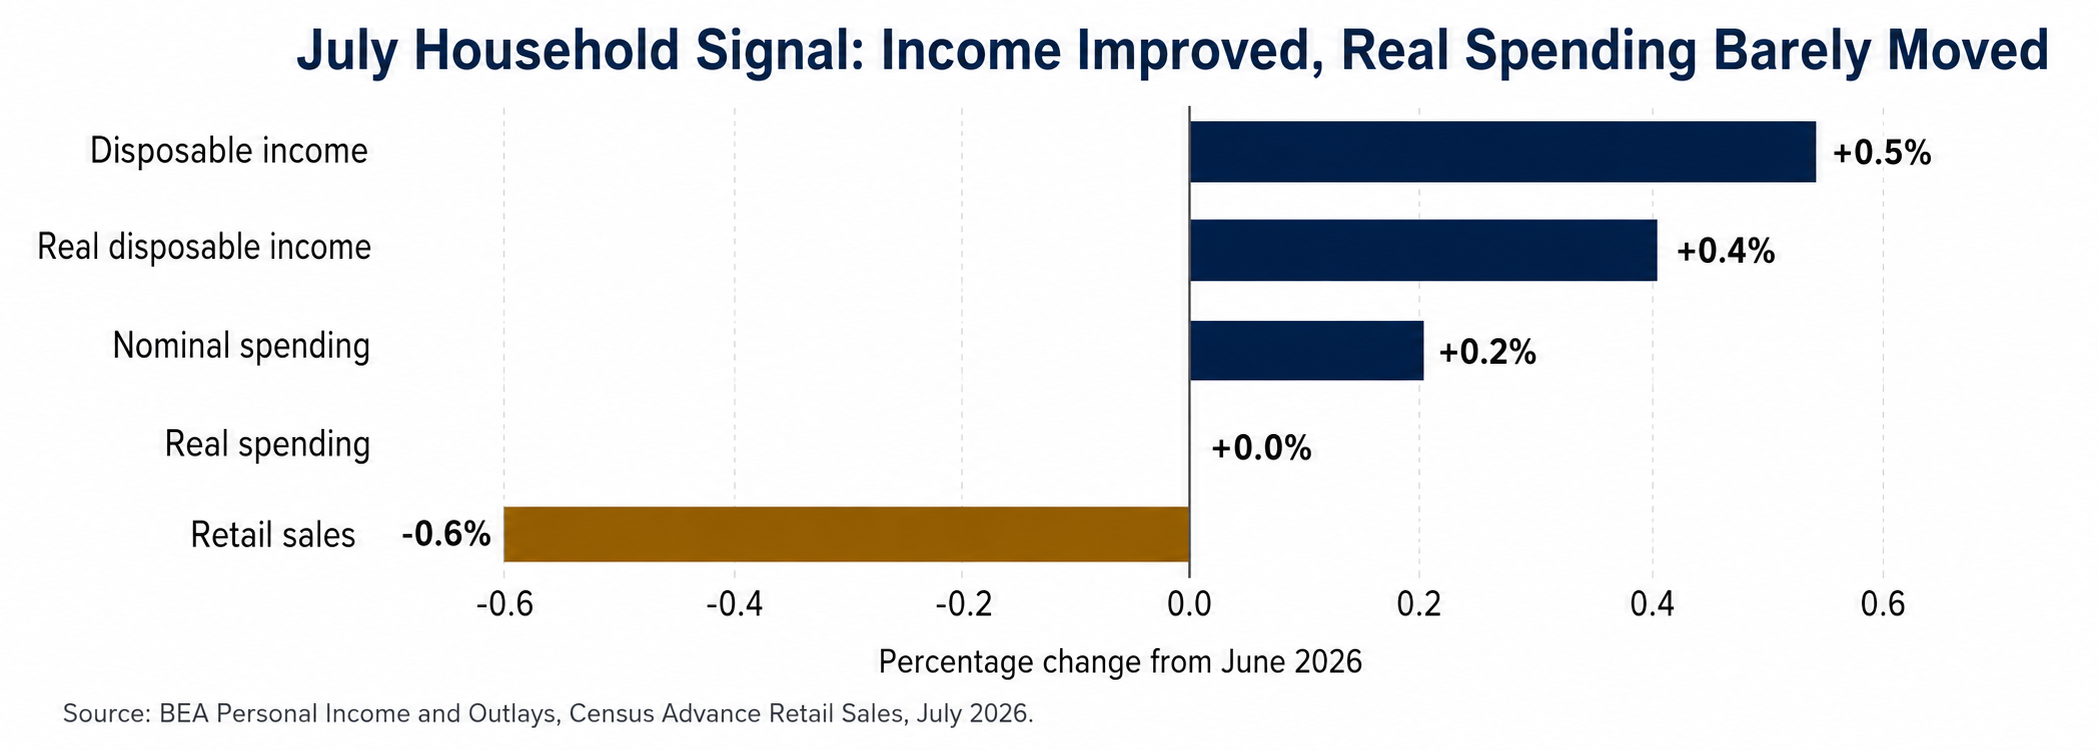
July is a good example of why the headline can mislead. Disposable personal income rose 0.5% and real disposable income rose 0.4%, but current-dollar consumer spending rose only 0.2% and real spending was essentially flat. Retail and food-service sales fell 0.6% from June even while remaining 5.0% above July 2025.
The composition matters too. BEA reported that the increase in current-dollar spending came from services, while spending on goods declined. Consumers have not stopped spending. They are choosing more carefully where the next dollar goes.
CEO IMPLICATION
Do not read stable or rising household income as automatic demand strength. Watch your own mix, close rates, order sizes, sales-cycle length, discounting, and whether customers are shifting spending rather than expanding it.
Labor: Stable Employment Does Not Mean a Strong Hiring Market
The labor market remains another clear example of separation. July payroll employment declined by 23,000 while the unemployment rate remained 4.1%. Labor-force participation was 61.4%. Broad layoffs remain limited, but hiring is much weaker than the unemployment rate alone suggests.
The better operating frame is: weak hiring, limited layoffs, and meaningful sector divergence. That can produce a frustrating combination for CEOs: slower aggregate job creation while skilled talent remains difficult and expensive to find in specific functions and markets.
OPERATING QUESTION
Can we find, afford, develop, and retain the people required for the business we are trying to build - not the business we operated last year?
Inventory & Cash Conversion: Activity Is Not Cash
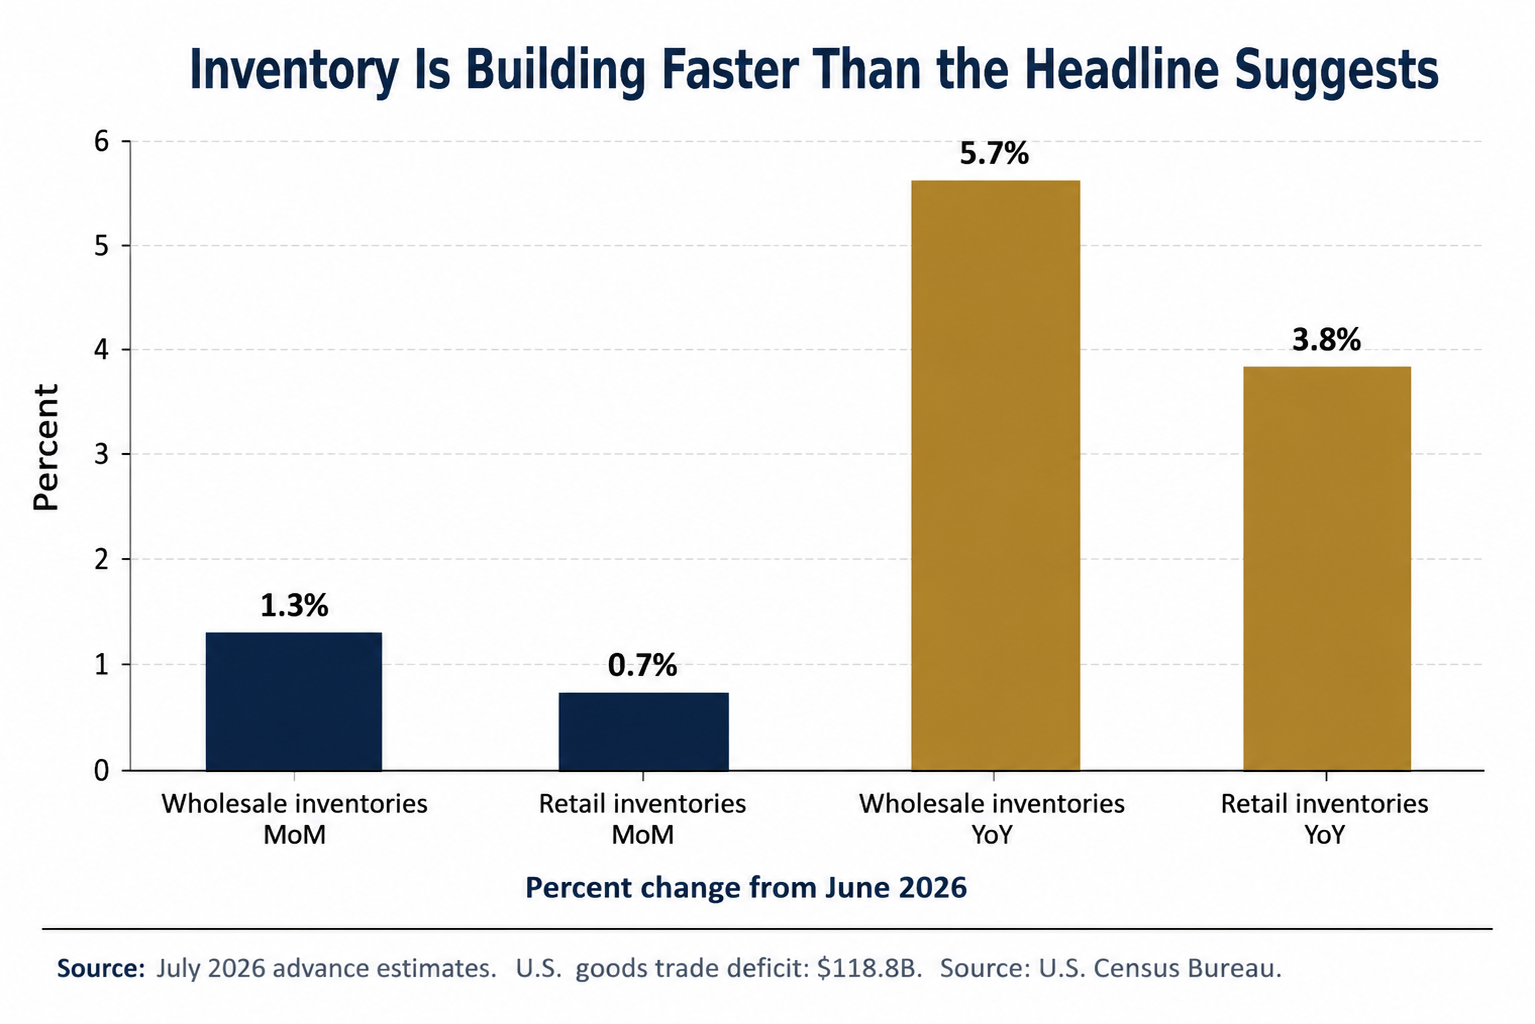
July wholesale inventories rose 1.3% from June and 5.7% from a year earlier. Retail inventories increased 0.7% for the month and 3.8% year over year. At the same time, the advance U.S. goods trade deficit widened to $118.8 billion as exports fell and imports increased.
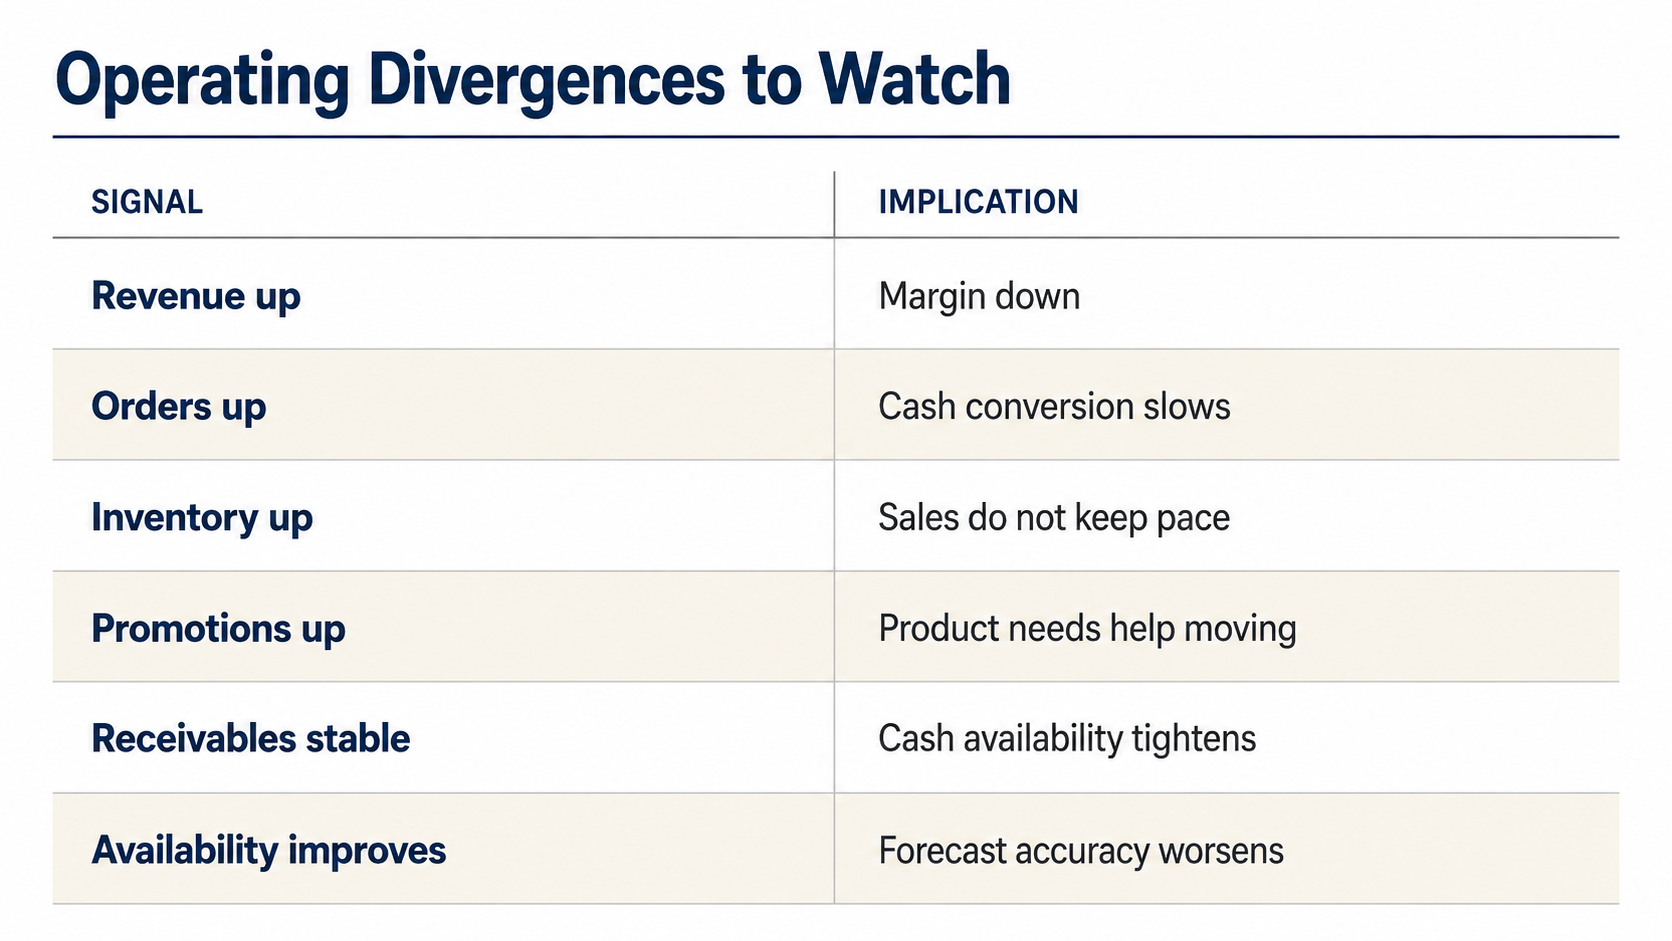
Inventory is not a problem simply because it rises. It becomes a leadership issue when inventory grows faster than demand, turns slow, promotions increase, or working capital becomes harder to explain. The risk is that activity remains visible while cash quietly becomes less available.
Inventory is only an asset while demand converts it into revenue and cash.
Hidden strain worth investigating
CEO IMPLICATION
The issue is not whether the economy is moving. It is whether that movement is converting into profitable demand and usable cash inside your business.
Operations: Some Channels Are Improving. Others Still Tighten.
Manufacturing and freight data reinforce the same pattern. Activity is improving in several channels, but capacity, cost, and geography are not moving together.
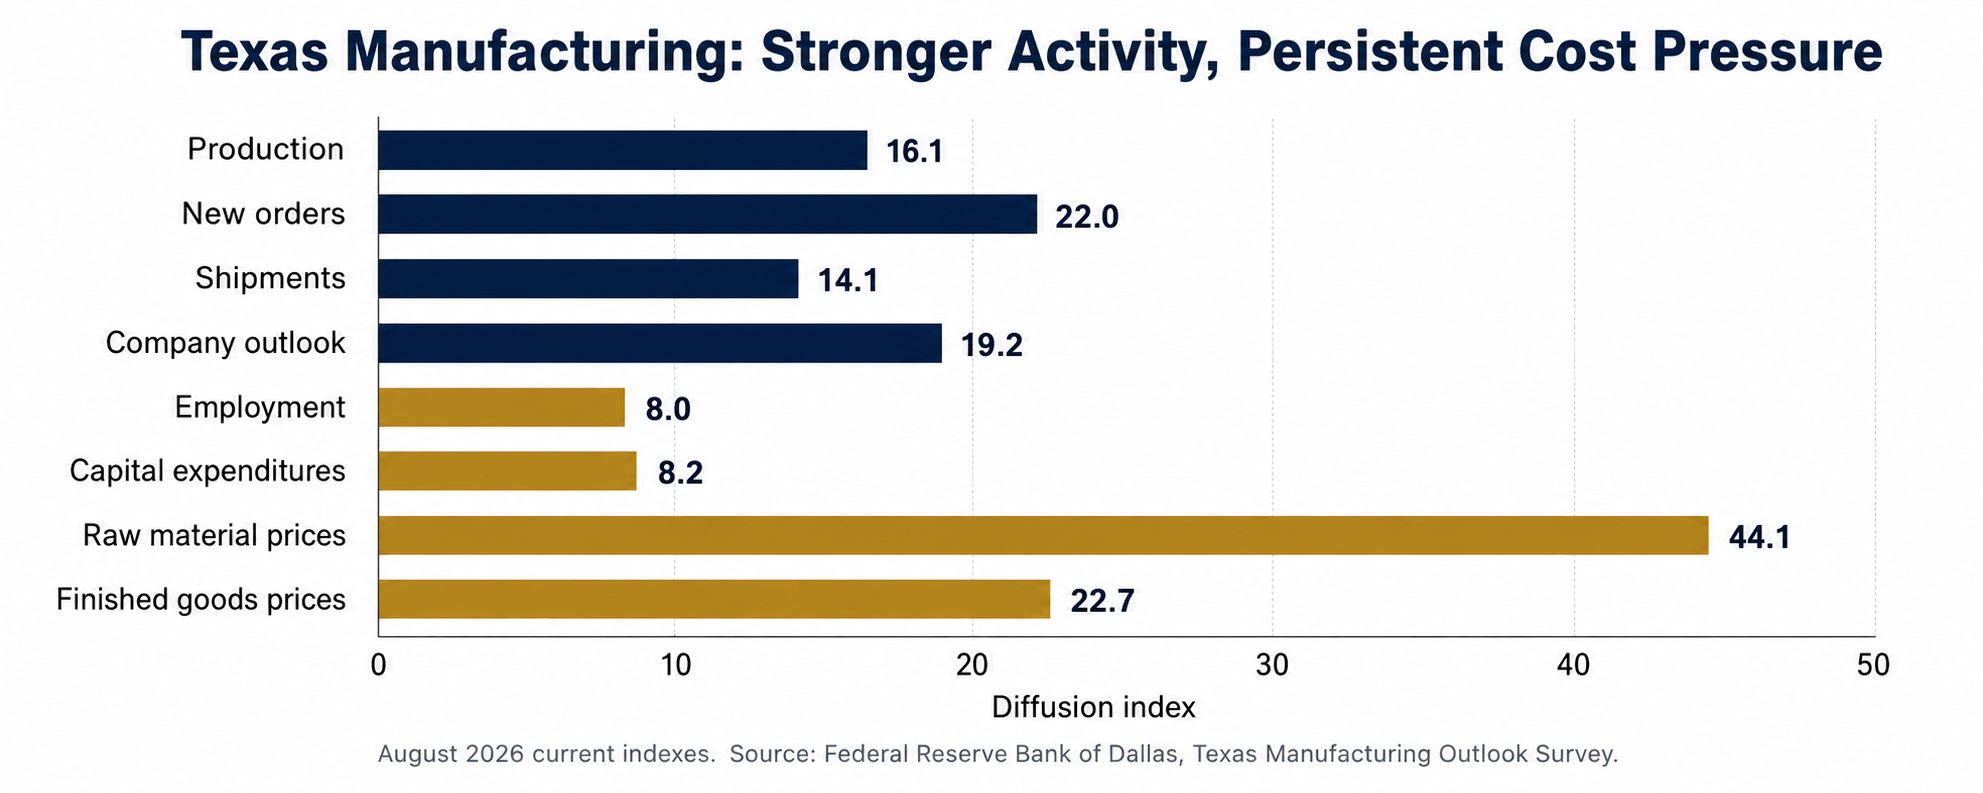
The Dallas Fed reported a clear acceleration in Texas factory activity in August. Production, new orders, shipments, and company outlook all strengthened. Yet employment growth and capital expenditures eased while raw-material prices remained markedly elevated.
This is what a separating economy looks like inside one regional manufacturing survey.
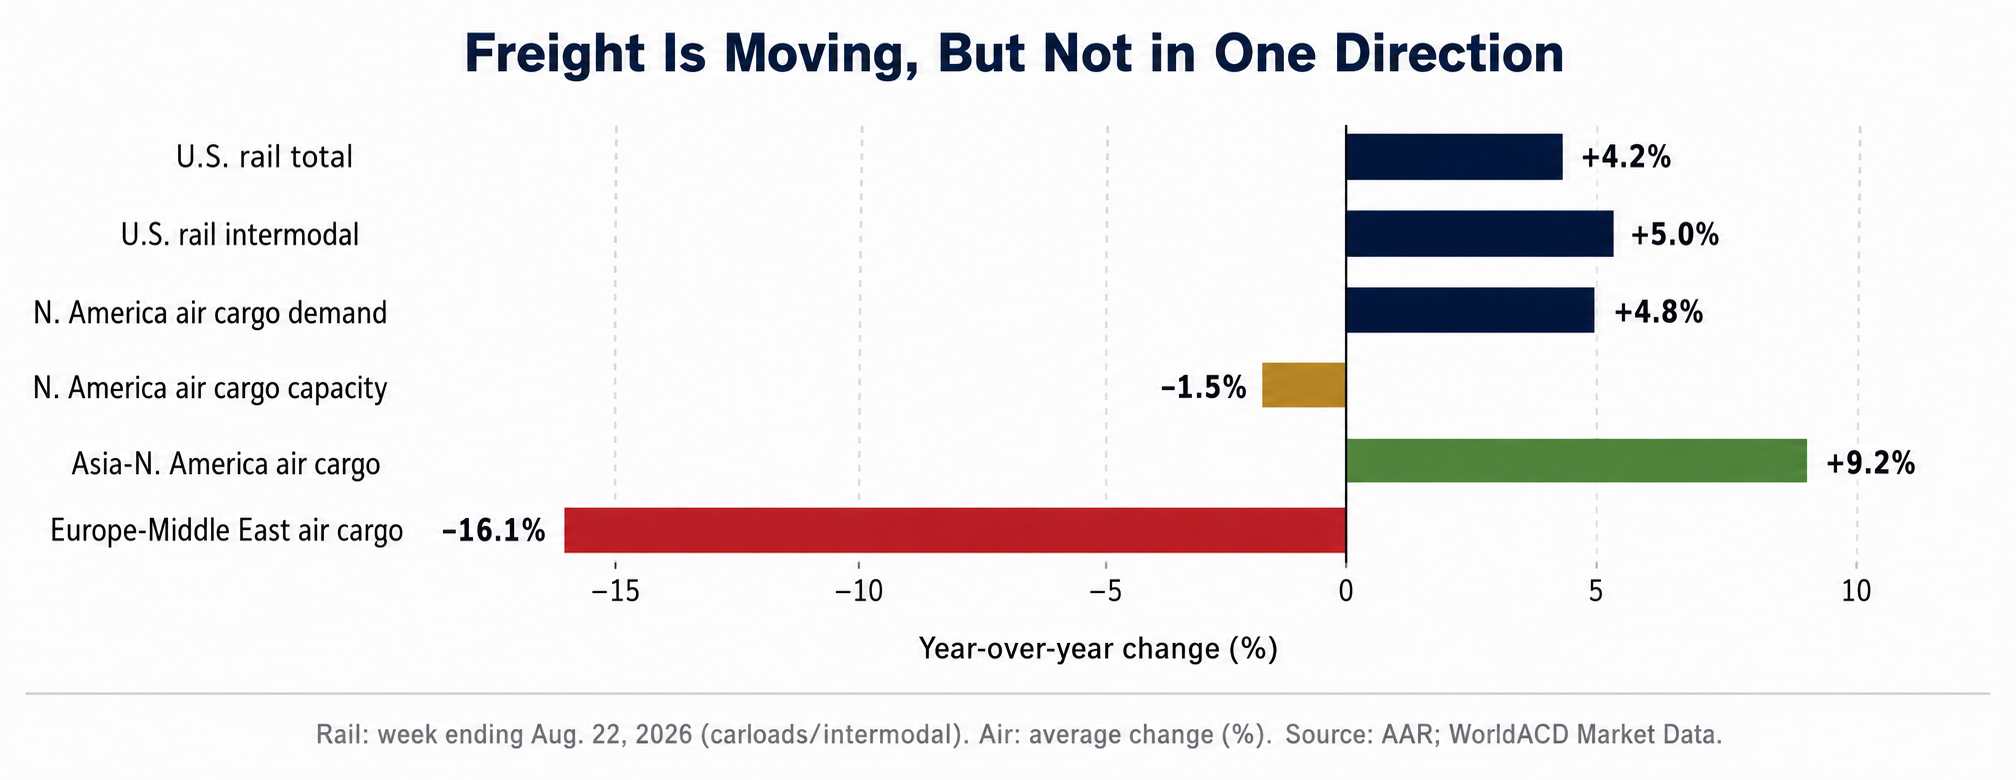
Freight tells the same story. U.S. rail traffic and intermodal volume were higher year over year. July North American air-cargo demand rose while capacity fell, and individual trade lanes ranged from strong growth to double-digit contraction.
CEO IMPLICATION
Do not ask whether supply chains are healthy in the abstract. Ask which mode, lane, supplier, customer segment, or geographic market is creating leverage - and which one is quietly becoming the constraint.
Capital Is Available. Conviction Is More Selective.
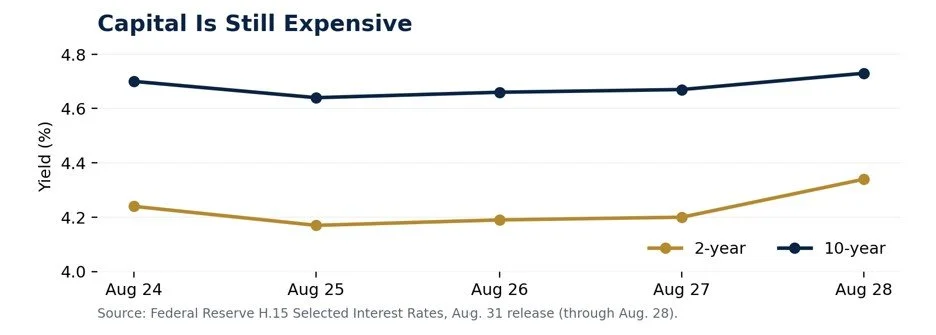
Capital continues to move through the economy, but availability and conviction are not the same thing. Long-term rates remain high enough to keep acquisitions, equipment, real estate, refinancing, and working capital expensive. The 10-year Treasury closed the latest available week at 4.73%, while the 2-year was 4.34%.
That does not mean businesses are standing still. It means the hurdle rate for action is higher. Strong companies may still invest, but they are increasingly selective about where the next dollar goes and what measurable return it must produce.
LEADERSHIP TEST
Are we investing because the opportunity is genuinely attractive, or because activity itself has become a substitute for conviction?
Geography Matters More Than the National Average Suggests
National averages remain useful context, but they are increasingly dangerous operating assumptions. State, county, metropolitan, and industry-level outcomes can diverge sharply. Texas may look comparatively healthy while individual sectors, labor pools, and local markets tell a different story. The economy experienced by a Dallas manufacturer can be very different from the economy experienced by a retailer, a professional-services firm, or a company operating in another region.
That makes local evidence and company-level leading indicators more important. The national number tells you the weather system. Your own data tells you whether it is raining on your building.
PRACTICAL COMPANION QUESTION
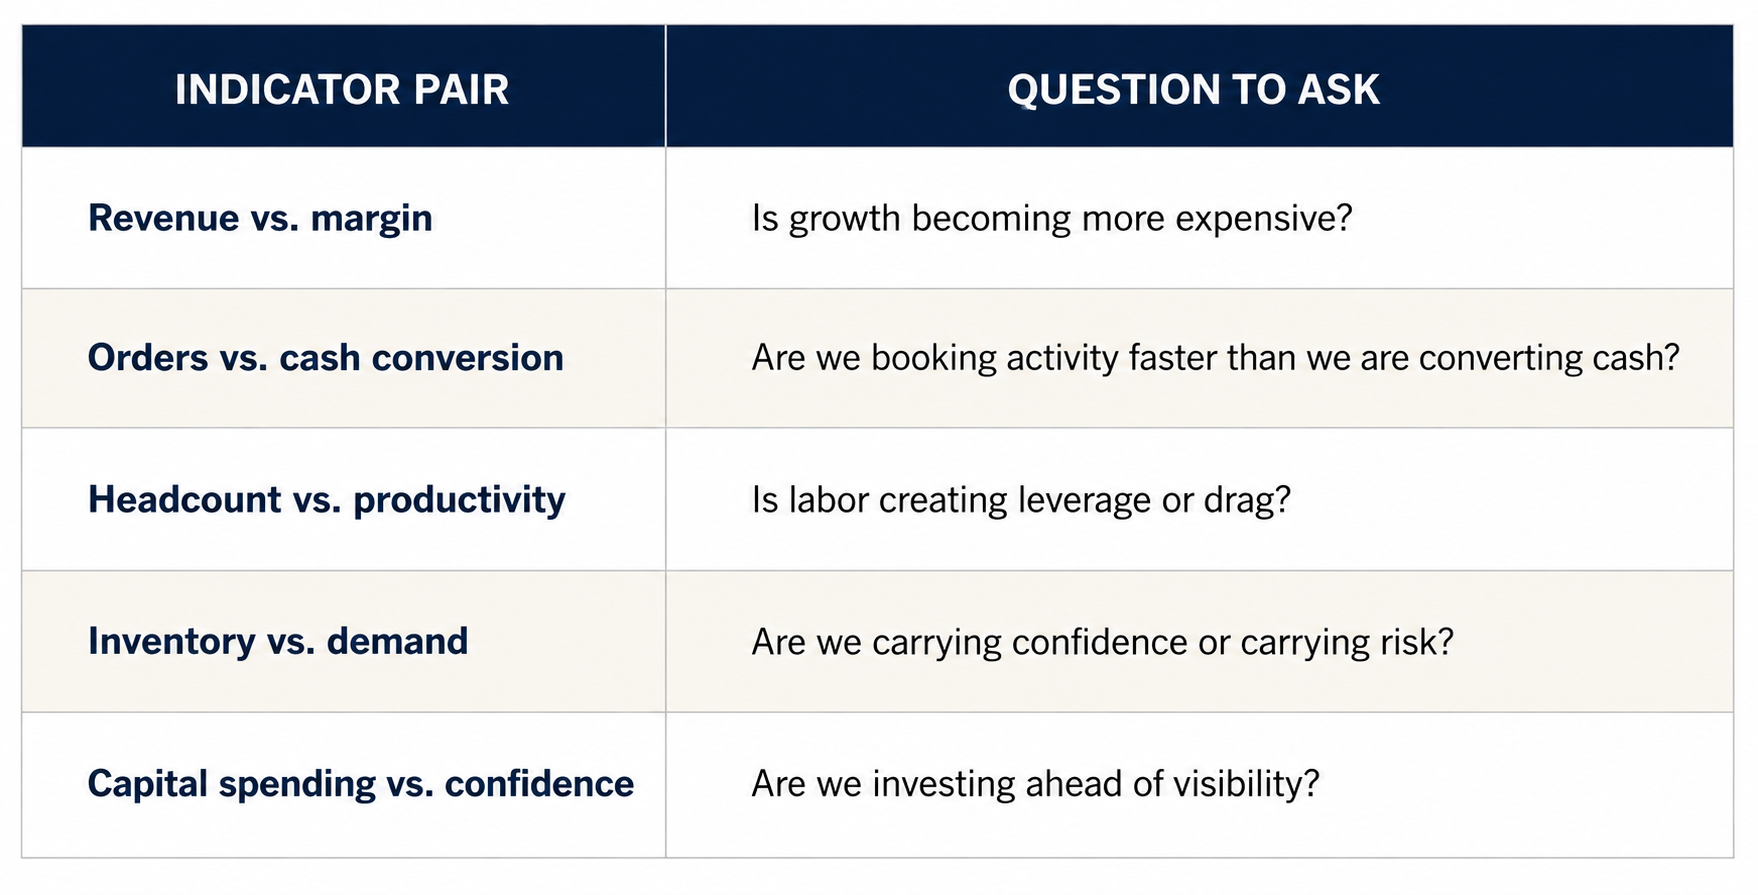
Which of my own indicators should move together, but currently are not?
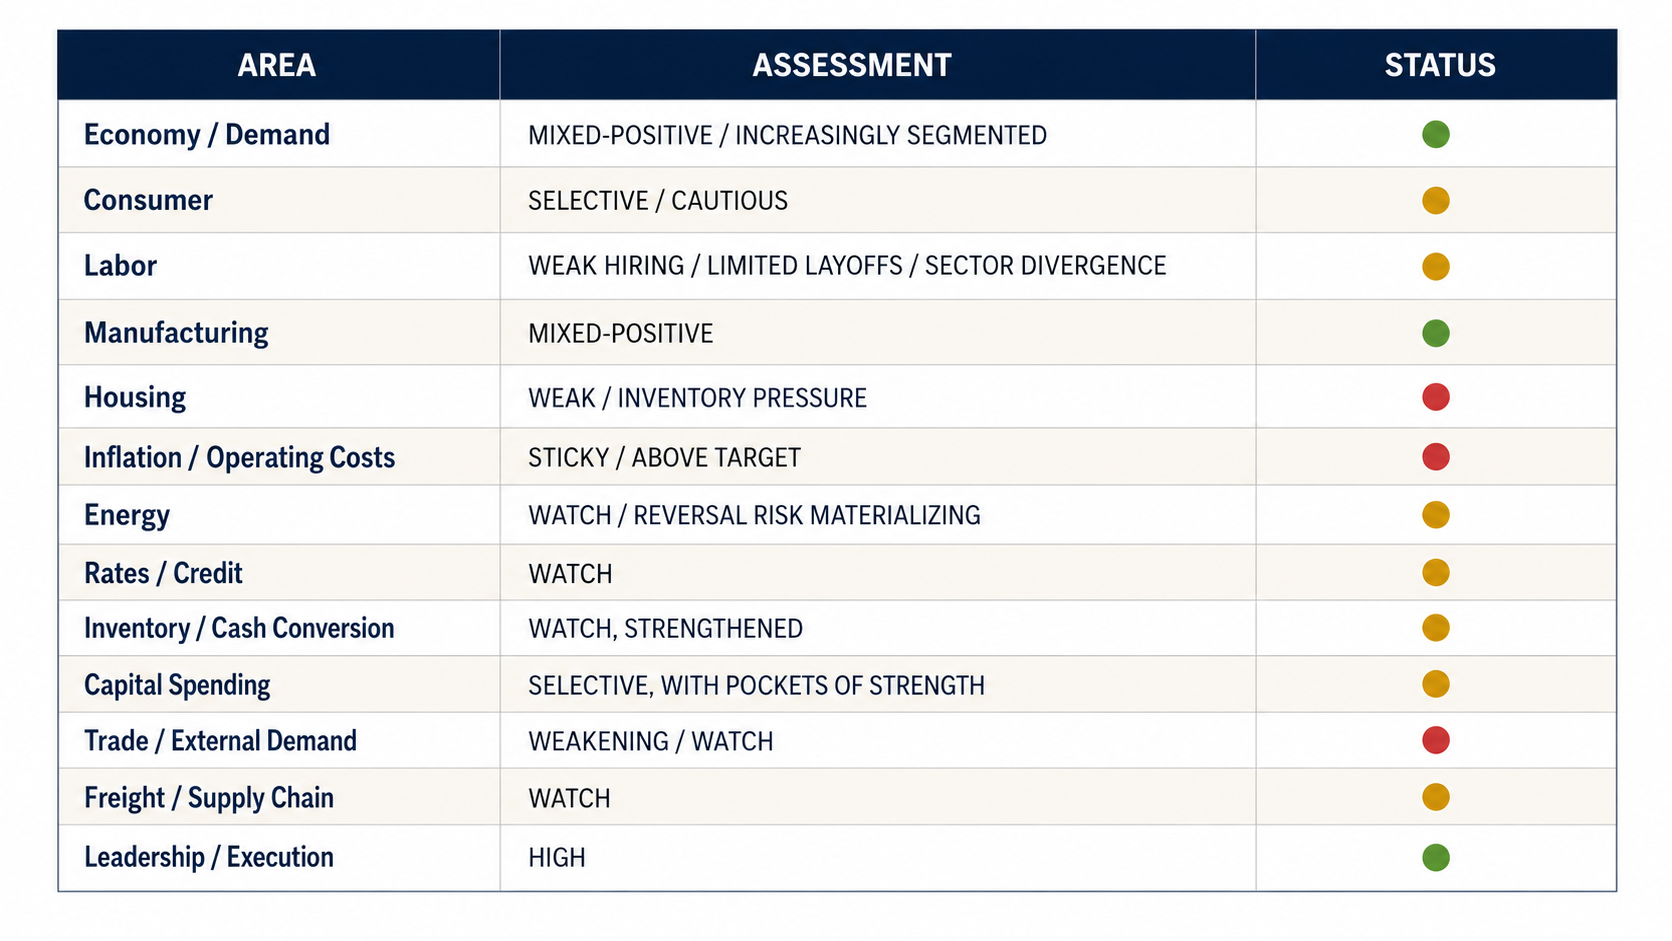
CEO Dashboard
The Leadership Agenda
A segmented economy is harder to lead through than either a broad expansion or a broad contraction because the signals conflict. The most valuable work for a CEO is to identify the internal indicators that normally move together but have started to diverge.
FINAL THOUGHT
Relief may be arriving, but not everywhere at once. Strong leadership begins by seeing the separation clearly and managing the business you actually have - not the headline economy you wish you had. The issue is not whether the economy is improving. It is whether your economics are.
Sources & Production Notes
This production draft is designed for executive scanning first and deeper reading second. The charts use the latest primary-source data available through August 31, 2026. Interpretations are Brandenburg Growth Partners analysis and are intended as decision support, not economic forecasting or investment advice.
U.S. Bureau of Economic Analysis: Personal Income and Outlays, July 2026. Disposable personal income +0.5% MoM; real DPI +0.4%; current-dollar PCE +0.2%; real PCE 0.0%; PCE price index +3.7% YoY; core PCE +3.3% YoY.
U.S. Census Bureau: Advance Monthly Sales for Retail and Food Services, July 2026: -0.6% MoM, +5.0% YoY. Advance Economic Indicators, July 2026: wholesale inventories +1.3% MoM / +5.7% YoY; retail inventories +0.7% / +3.8%; goods trade deficit $118.8B.
Federal Reserve Board: H.15 Selected Interest Rates, Aug. 31, 2026 release: Aug. 28 2-year Treasury 4.34%; 10-year Treasury 4.73%.
Federal Reserve Bank of Dallas: Texas Manufacturing Outlook Survey, Aug. 31, 2026: production 16.1; new orders 22.0; shipments 14.1; company outlook 19.2; employment 8.0; capital expenditures 8.2; raw-material prices 44.1; finished-goods prices 22.7.
Association of American Railroads: Week ending Aug. 22, 2026: U.S. total rail traffic +4.2% YoY; intermodal +5.0%.
International Air Transport Association: July 2026 air cargo: North America demand +4.8% YoY, capacity -1.5%; Asia-North America +9.2%; Europe-Middle East -16.1%.
The Conference Board: August 2026 Consumer Confidence Index 89.4; Expectations Index 68.2; Present Situation Index 121.2.
