
October 2026 | Issue 3: Quality Of Growth
When more revenue doesn't automatically create more value
A better economic headline does not automatically create better economics inside your business.
EXECUTIVE SUMMARY
The U.S. economy is still growing. That isn't really the question anymore.
The more useful question for CEOs is what that growth is producing inside the business.
Real GDP increased at a 2.2% annual rate in the second quarter of 2026. Real final sales to private domestic purchasers increased 4.6%, and corporate profits from current production increased $384.0 billion in the quarter.
August real PCE increased 0.6%, while real disposable personal income was unchanged. September payroll employment increased 29,000 and unemployment remained 4.2%.
Manufacturing expanded for the ninth consecutive month in September, with the ISM Manufacturing PMI at 54.5. New orders rose to 55.3 and backlogs to 56.4, but production slowed from 58.3 to 56.7 and the Prices Index jumped from 71.1 to 77.9.
The latest available August PPI showed final-demand prices up 5.4% year over year. Diesel fuel prices jumped 24.1% in August.
The economy is growing. But growth is encountering friction.
The question for CEOs isn't just whether demand exists. It's whether the business can convert that demand into margin, cash, capacity and ultimately enterprise value.
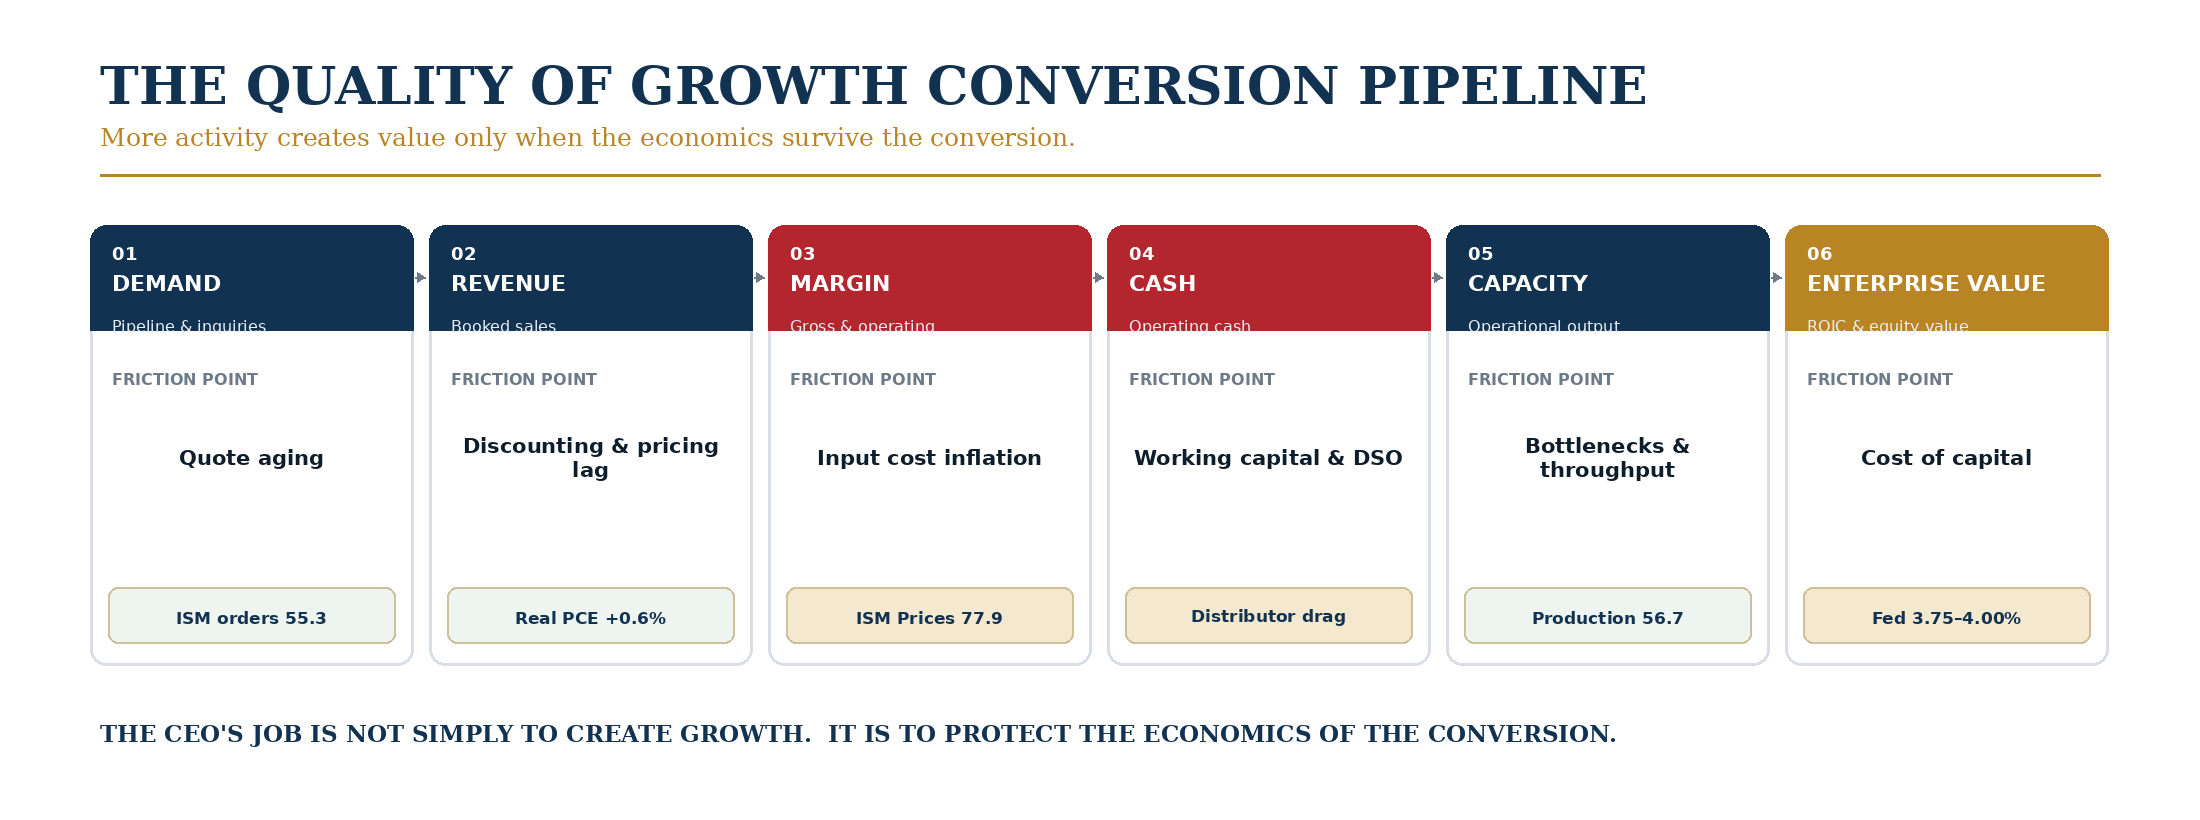
The governing chain: demand → revenue → margin → cash → capacity → enterprise value.
01 | THE ECONOMIC PICTURE
Growth is real. Conversion is the question.
The September data makes it harder to describe the economy as simply strong or weak. GDP growth is positive. Consumer spending is positive. Manufacturing is expanding. Corporate profits increased. New orders and backlogs are growing.
At the same time, employment growth is subdued, real disposable income was flat in August, producer prices remain elevated, and the manufacturing input picture has become more expensive.
That matters because the economic headline and the CEO's P&L aren't the same thing.
“A company can have more orders without more margin, more revenue without more cash, and more customers without more capacity.”
Demand Growth vs. Input Cost Pressure
New orders and backlogs confirm real demand. The problem is that input costs are moving in the same direction, and in some cases faster. That creates a margin question that order volume alone can't answer.
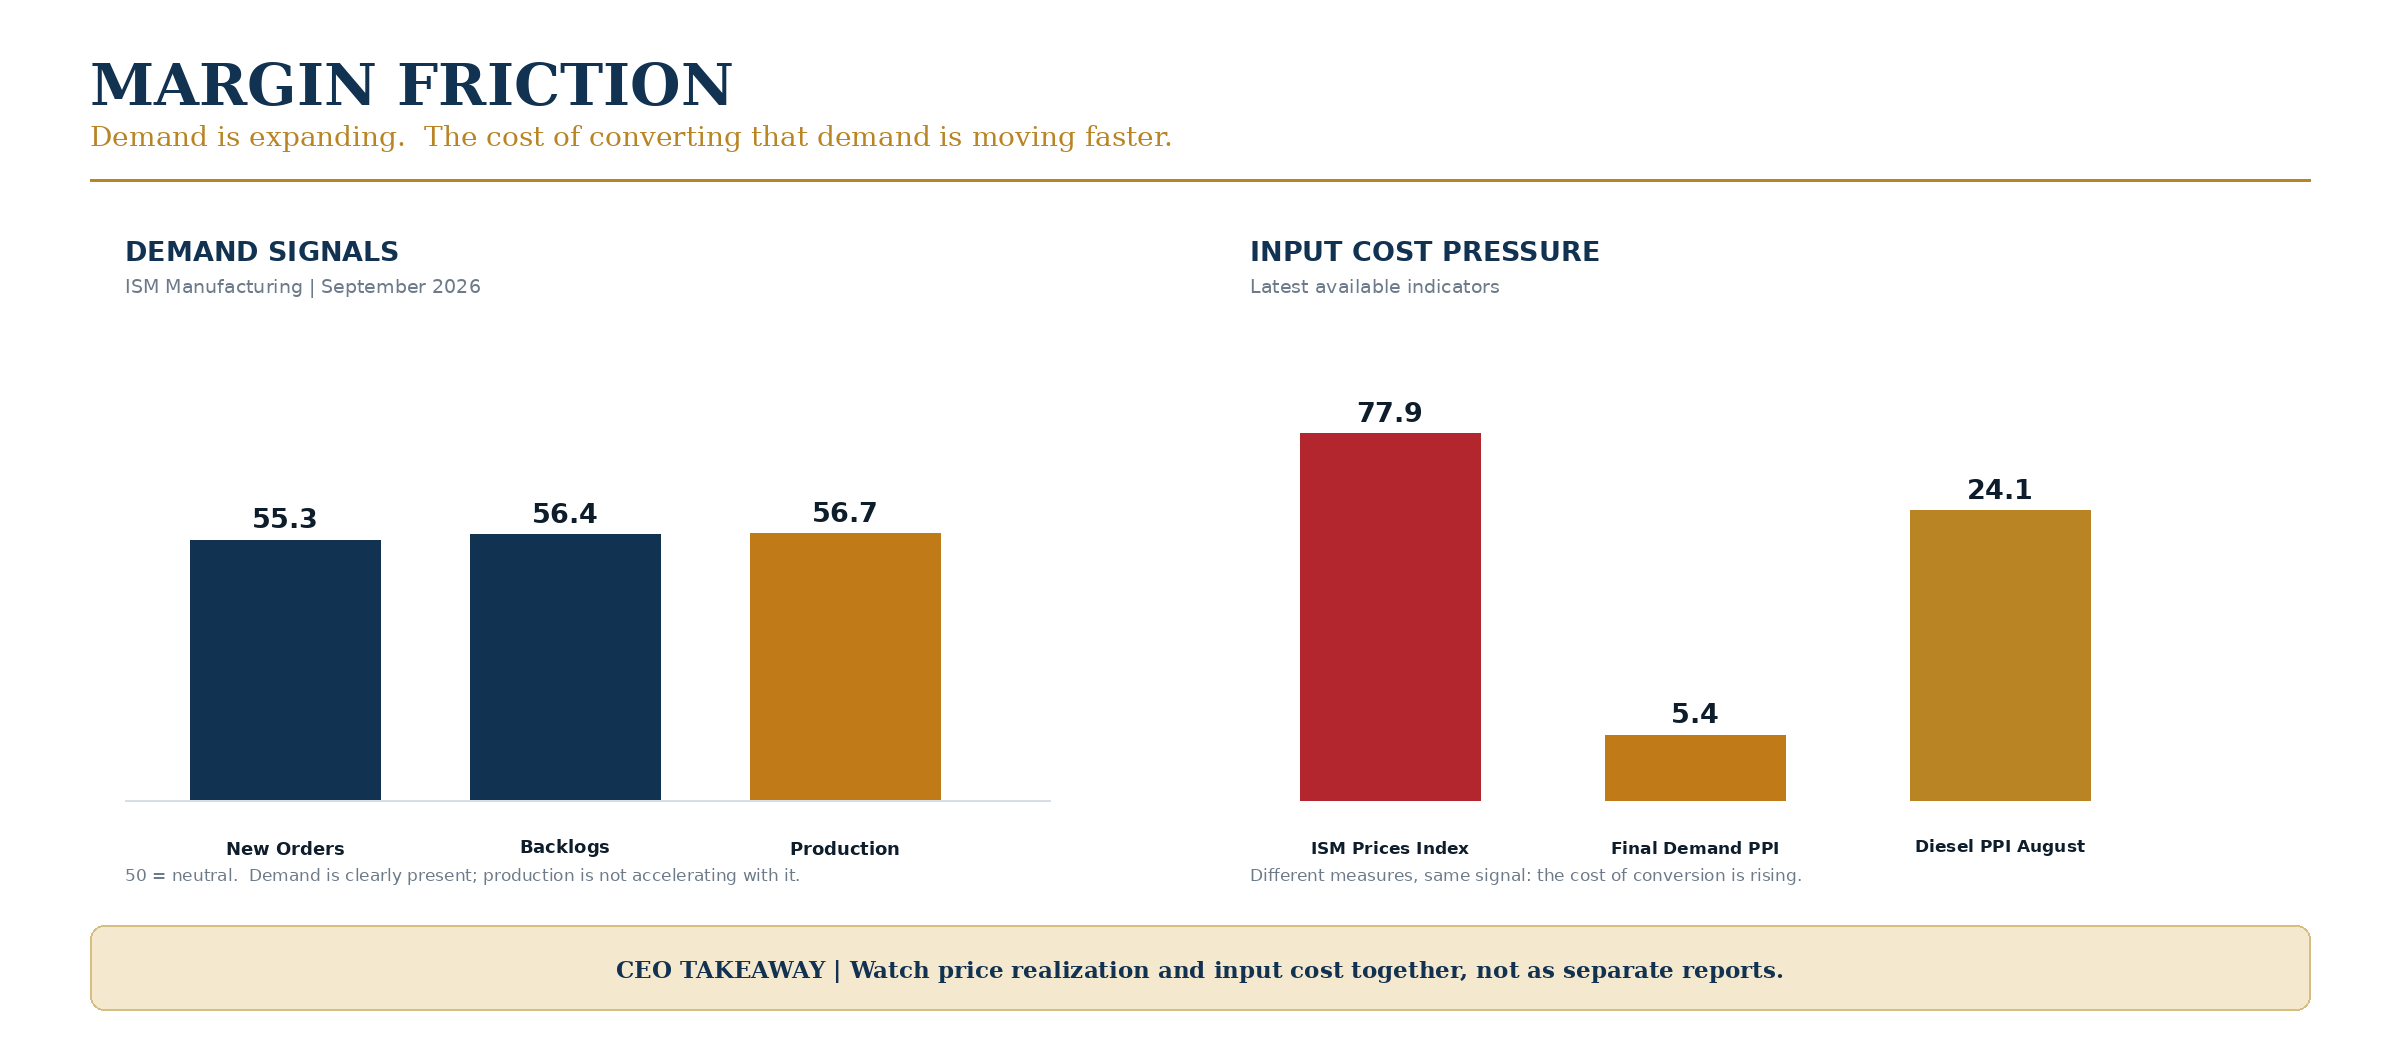
Visual anchor: demand indicators and cost pressure should be read together.
OPERATING QUESTION
If your next 10% of revenue carries today's input costs, how much of that growth actually reaches operating profit?
02 | THE CONVERSION NODES
Cash and capacity are where growth gets real.
Cash and capacity are different conversion problems. Growth can require cash before it produces cash, and a market can expand faster than the operating system can respond.
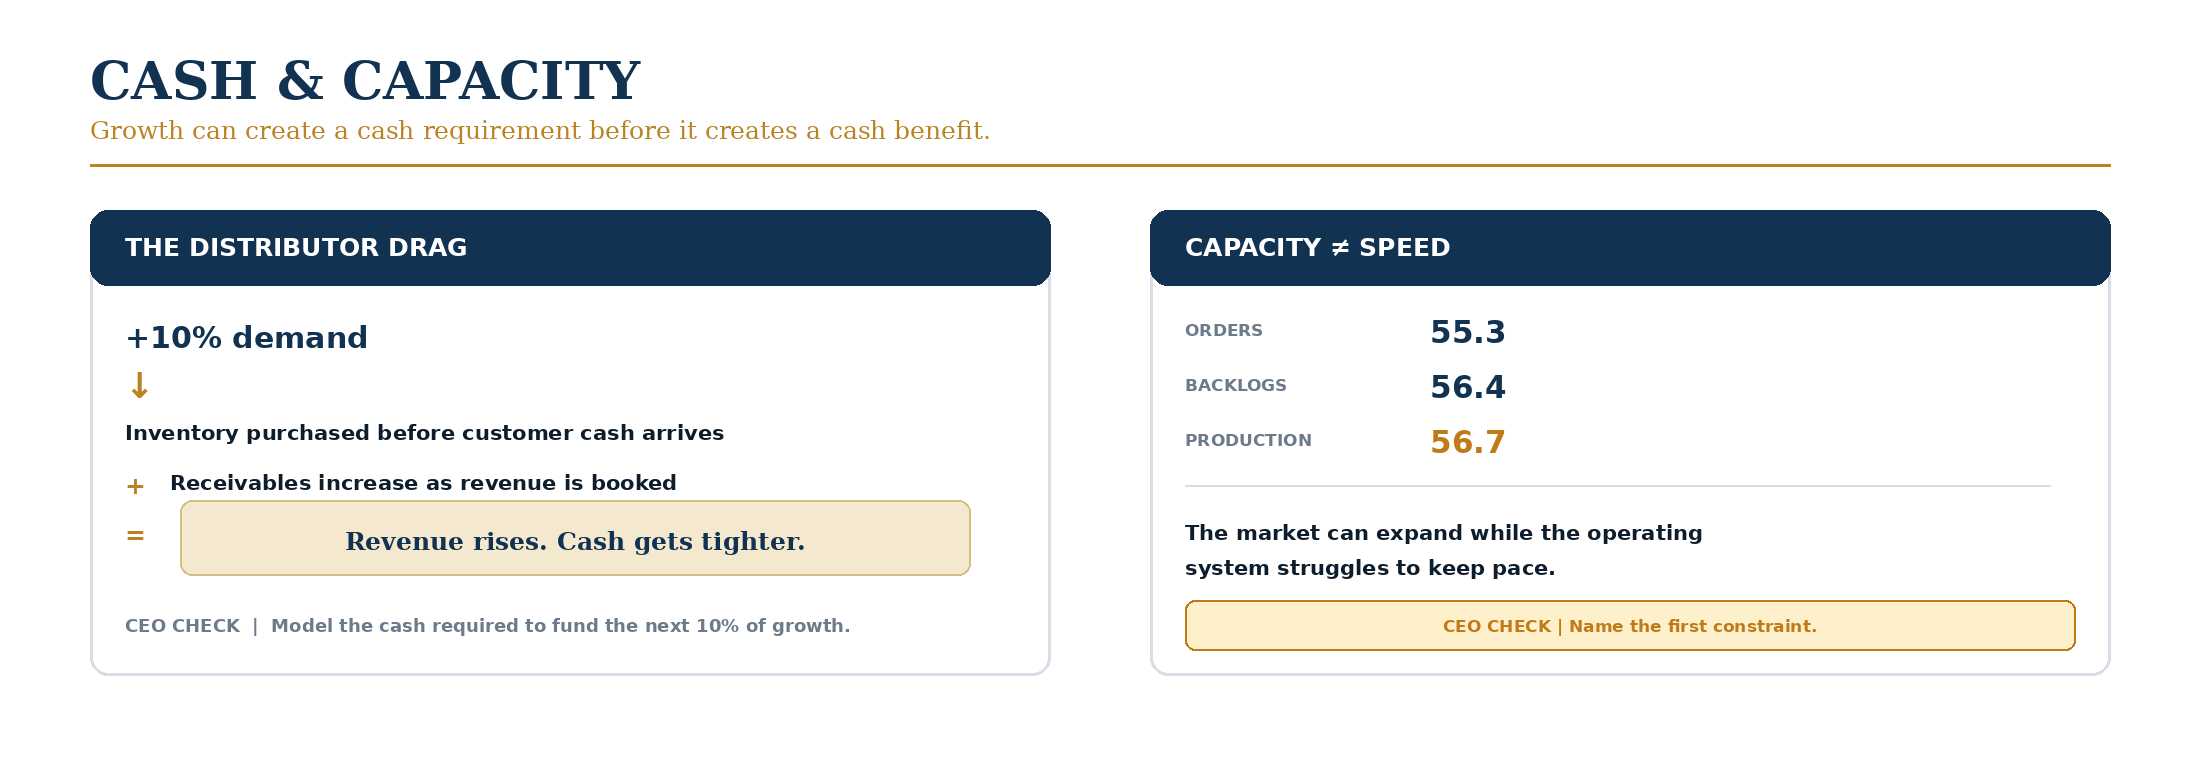
The working-capital trap and the throughput bottleneck are two different problems. Both can limit the economics of growth.
Margin → Cash
Imagine a middle-market distributor whose demand suddenly jumps 10%. Inventory has to be purchased before customer cash arrives, while receivables increase as sales are booked. If DSO extends, the cash requirement grows at exactly the moment the company is trying to serve more demand.
The business can therefore report stronger revenue while its bank balance gets tighter. That's the distributor drag: growth creates a working-capital requirement before it creates a cash benefit.
CEO IMPLICATION
Model the cash required to fund the next 10% of growth before you commit to the sales target. Revenue forecasts without a working-capital view are incomplete.
Cash → Capacity
September's ISM report shows why capacity and speed aren't the same thing. New orders were 55.3 and backlogs 56.4, yet production slowed from 58.3 to 56.7.
The market can expand while the operating system struggles to keep pace. Demand can accelerate faster than production, production faster than skilled labor, and headcount faster than management capacity.
CEO IMPLICATION
Identify the first constraint that will slow the business: people, equipment, systems, inventory, supplier capacity, management attention or cash.
03 | OCTOBER CEO DASHBOARD
The environment matters. The internal response matters more.
The dashboard separates what the CEO can't control from what the CEO can influence directly. The left side describes the environment. The right side describes what management must actively inspect inside the company.
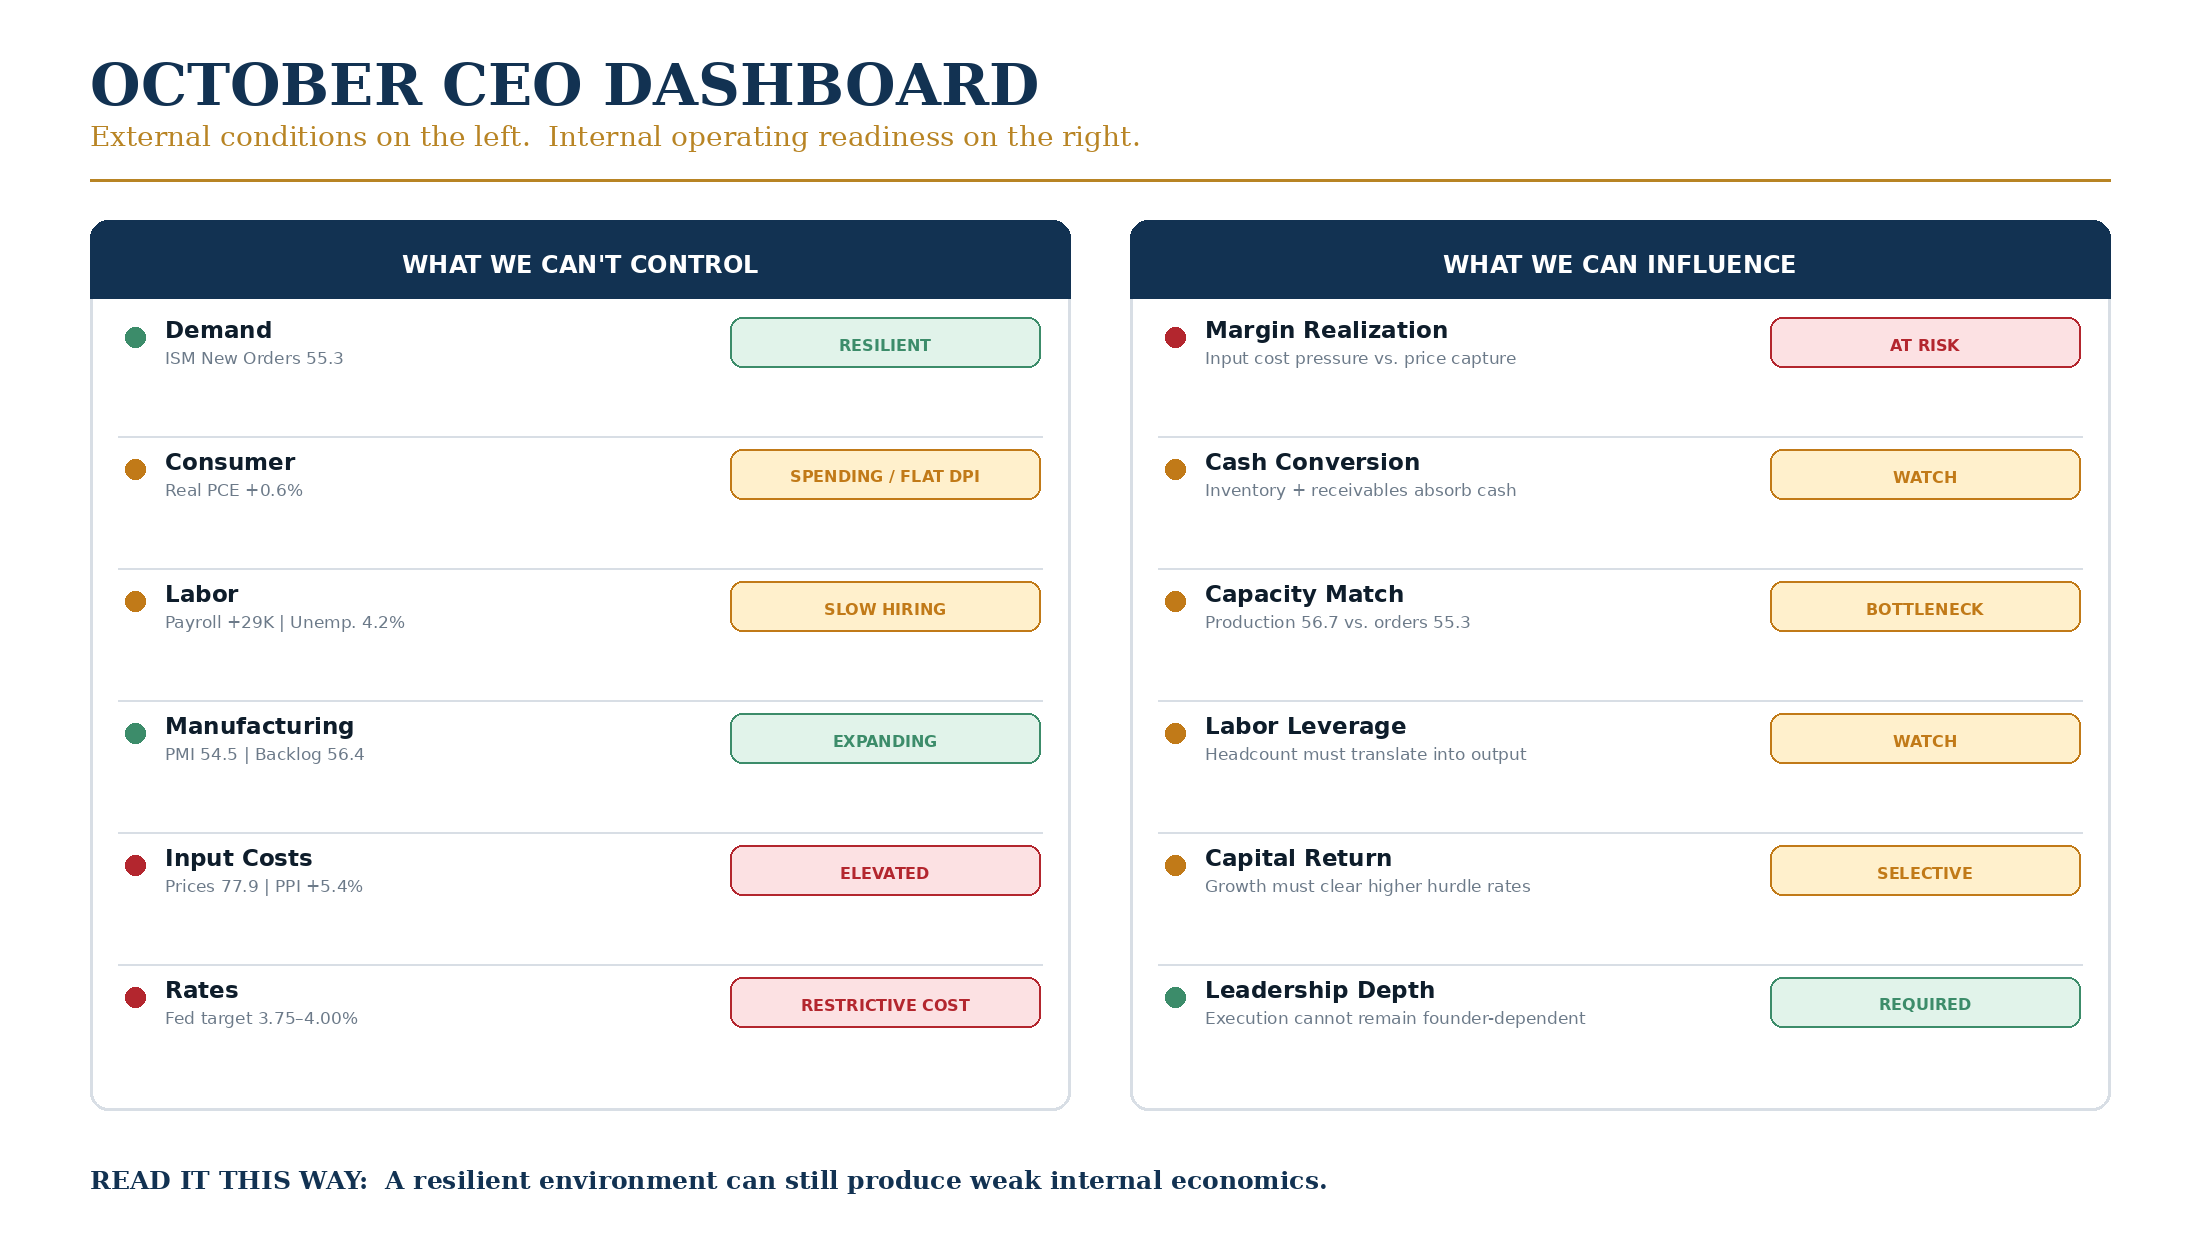
Executive scanning first: external signals on the left, internal operating readiness on the right.
THE LEADERSHIP AGENDA
A business can be operating in a growing economy and still have a growth problem.
· Demand can be rising while margins compress.
· Revenue can be rising while cash conversion slows.
· Backlogs can be rising while production capacity falls behind.
· Headcount can be rising while leadership capacity becomes the constraint.
· Capital can be available while the return required to justify it remains high.
The CEO's advantage is seeing the mismatch before it becomes a financial surprise.
04 | THE CEO TEST
Assume demand increases 10% tomorrow.
Don't celebrate it yet. Ask what happens next.
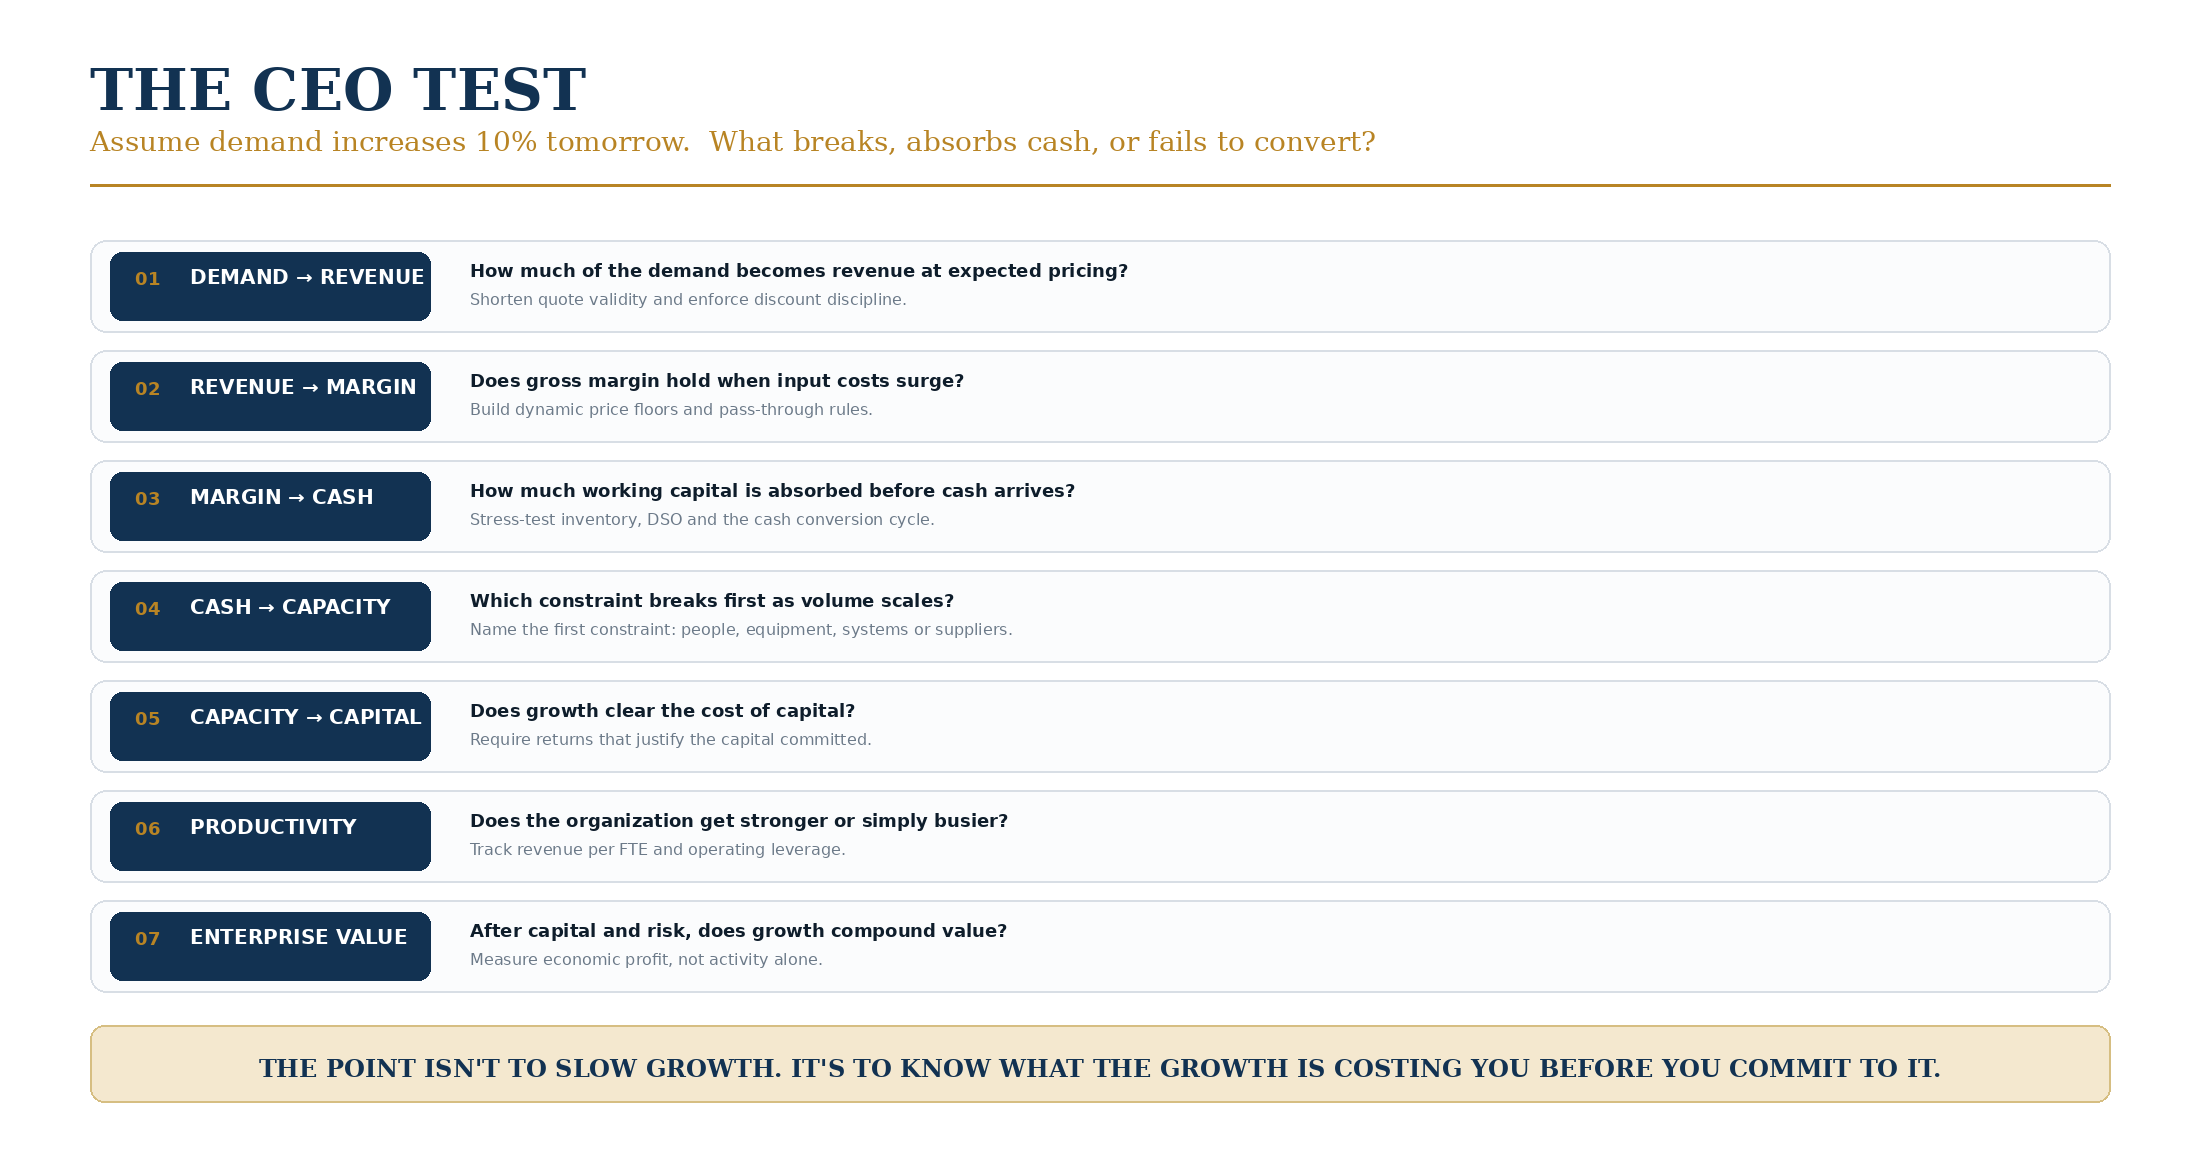
The test is not whether you can grow. It is whether you can grow without weakening the economics of the business.
CEO ACTION CHECKLIST
· Test the economics of the next 10% of demand before committing to the capacity required to serve it.
· Know whether pricing discipline is protecting margin as input costs rise.
· Model the working-capital requirement of growth, not just the revenue opportunity.
· Identify the operational constraint that will slow the business first.
· Separate productive capacity from simply adding headcount.
· Measure whether growth is increasing cash generation and enterprise value, not just activity.
FINAL THOUGHT
The economy doesn't need to be falling apart for CEOs to have a problem. Sometimes the harder environment to lead through is one where demand is improving while the cost of converting that demand remains high.
That's where discipline matters. Know where the growth is coming from. Know what it costs to capture it. Know how much cash it consumes. Know what capacity it requires. And know whether the organization is becoming stronger as it grows.
Because eventually, the question isn't: How fast are we growing? It's: What are we becoming because we're growing?
05 | SOURCES & PRODUCTION NOTES
Research cutoff: October 2, 2026
September CPI and September PPI are not used because they had not been released as of the cutoff. Interpretations are Brandenburg Growth Partners analysis and are intended as CEO decision support, not economic forecasting or investment advice.
· U.S. Bureau of Economic Analysis — GDP (Third Estimate), Industries, Corporate Profits, State GDP, and State Personal Income, Q2 2026; released September 30, 2026.
· U.S. Bureau of Economic Analysis — Personal Income and Outlays, August 2026; released September 30, 2026.
· U.S. Bureau of Labor Statistics — Employment Situation, September 2026; released October 2, 2026.
· Institute for Supply Management — September 2026 Manufacturing ISM Report on Business; released October 1, 2026.
· U.S. Bureau of Labor Statistics — Producer Price Index, August 2026; released September 10, 2026.
· Federal Reserve — FOMC statement / federal funds target range, September 16–17, 2026.
